

Data description
We analyzed imaging and clinical data from the Osteoarthritis Initiative (OAI), a large, multi-center longitudinal study investigating OA progression and outcomes over a decade33. The dataset included knee radiographs and dual-knee MRIs from 4796 participants, collected at baseline and follow-up visits conducted at 12, 24, 36, 48, 72, and 96 months. The imaging protocol incorporated 3D double-echo steady-state (3D-DESS) and 2D multi-slice multi-echo (2D-MSME) MRI scans, complemented by detailed demographic and clinical data such as age, sex, BMI, pain scores, and functional assessments (see Supplementary Data 1).
At baseline, after initial data cleaning steps, the cohort consisted of 4283 participants. The sex distribution was 58.2% female (n = 2494) and 41.8% male (n = 1789). Participants had a median age of 61 years (interquartile range [IQR]: 16 years), encompassing a broad age range from middle-aged to elderly adults. The median BMI was 28.2 kg/m² (IQR: 6.5 kg/m²), indicating that the cohort included individuals from normal weight to obese categories. The dataset incorporated clinical evaluations such as the Knee Injury and Osteoarthritis Outcome Score (KOOS)34, which evaluates pain, physical function, and quality of life-related to knee health. At baseline, the KOOS Pain subscale had a median score of 88.9 (IQR: 25), and the KOOS Quality of Life (QOL) subscale had a median score of 68.8 (IQR: 33.3), indicating varied perceptions of knee-related pain and quality of life among participants. Detailed distributions of the study population’s baseline demographic and clinical characteristics are provided in Supplementary Data 2.
Imaging biomarker extraction and dimensionality reduction
MRI data from all subjects underwent advanced neural network-based segmentation to delineate the femoral, tibial, and patellar cartilage, as well as meniscus and bone structures. The segmentation models validated using a subset of OAI data, achieved Dice coefficients above 0.85 for soft tissues and 0.95 for bones, confirming their accuracy and suitability for imaging biomarker extraction (see “Methods” section: Automatic Knee Joint Tissue Segmentation).
From these segmentations, we derived a suite of imaging biomarkers that captured structural and compositional variations in the knee joint. These biomarkers included cartilage thickness, cartilage T2 relaxation times, and geometric features of bone and meniscus shapes, which collectively characterize the health and integrity of the joint components. Given the high dimensionality of the extracted data, principal component analysis (PCA) was applied independently to each tissue type and biomarker category. This approach ensured that the most salient variations specific to each tissue and biomarker were retained while maintaining interpretability (Supplementary Data 3).
A total of 110 principal components (PC) modes were computed across tissue and biomarker types, balancing variance capture with practical interpretability. Each tissue-biomarker combination captured 45–80% of the variance within the first 10 PCs, a threshold chosen to support meaningful visualization and clinical interpretation (Supplementary Fig. 1). This dimensionality reduction facilitated focused analyses while preserving essential biological variability for downstream investigations.
Interactive visualization and interpretation of imaging biomarkers
To promote the interpretation of the 110-dimensional PCA feature space, we developed a visualization tool (Fig. 2). The visual interface is useful for characterizing structural and compositional tissue changes represented by a PC mode, and considering its clinical applicability. The tool displays the average 3D representation of a joint feature alongside variations at both ends of the distribution curve, simulating the range of values seen within the patient population. Radiologists can examine these feature shifts in order to better understand the variability captured by each mode.

This figure presents an interactive tool designed for radiologists and researchers, enabling the exploration and interpretation of a 3D representation of the OAI Knee Imaging Feature Space within a 110-dimensional Principal Component Analysis framework. a 3D Biomarker visualization: This interface allows users to explore the PCA feature space by selecting specific joint tissues and imaging biomarkers. It displays expert radiologist interpretations for notable deviations within ±3 standard deviations from the mean value in the selected PC. The platform supports community engagement by enabling users to contribute their interpretations, interact with community insights, and express confidence in the prevailing interpretations. b Progress tracking and community insight dashboard: The ‘Check-List’ tab within the app serves as a hub for users to track their review of the multidimensional feature space, allowing them to mark the analysis status of various PC modes. It enables filtering by tissue, biomarker, and PC dimension, and presents a consolidated view of community interpretations, capturing both consensus and dissent on insights from the feature space.
The tool integrates PCA-derived features with their anatomical context, providing a framework for analyzing this complex imaging data. Radiologists used it to evaluate the top 10 PC modes for each biomarker in the baseline data. Tables to summarize mean values and observed variations (mean ± 3 standard deviations) are provided in Supplementary Figs. 2–11. These analyses clarify the anatomical and compositional features captured by PCA and qualify the extracted biomarkers as interpretable and clinically meaningful.
Cohort selection
To investigate specific knee outcomes, including OA Incidence and Knee Replacement (KR), baseline MRI data were selected according to predefined inclusion and exclusion criteria to ensure data quality and reliability. These criteria involved excluding subjects with incomplete imaging data, missing clinical records, or inadequate scan quality during preprocessing. This approach verified that only subjects with comprehensive and high-quality data were included in the subsequent analyses. We addressed minimal missing data through multiple imputations, followed by sensitivity analyses using Kolmogorov–Smirnov tests to confirm that imputation preserved the original data distributions (Supplementary Data 4 and 5).
Cohort matching was performed to create comparable groups for accurate identification of imaging biomarkers associated with specific knee outcomes, reducing potential confounding effects from demographic and clinical variables. We used t-distributed Stochastic Neighbor Embedding (t-SNE)35 on standardized demographic and clinical covariates, followed by nearest-neighbor matching in the embedded space (see “Methods” section: Cohort Matching). This approach was designed to reduce disparities in key variables such as age, BMI, and pain scores between the Outcome and Control groups, thereby enhancing the comparability of the cohorts.
Figure 3 illustrates the selection process, showing the progression from the initial dataset to the finalized cohorts prepared for analysis. In Fig. 3a, we detail the OA Incidence cohort selection, comprising subjects with no radiographic OA (Kellgren-Lawrence Grade [KLG] <2) at baseline who were monitored for OA development over time. Matched controls with similar demographic and clinical profiles were included to ensure a balanced comparison. Figure 3b depicts the KR cohort, comprising participants who underwent knee replacement surgery and their matched controls.
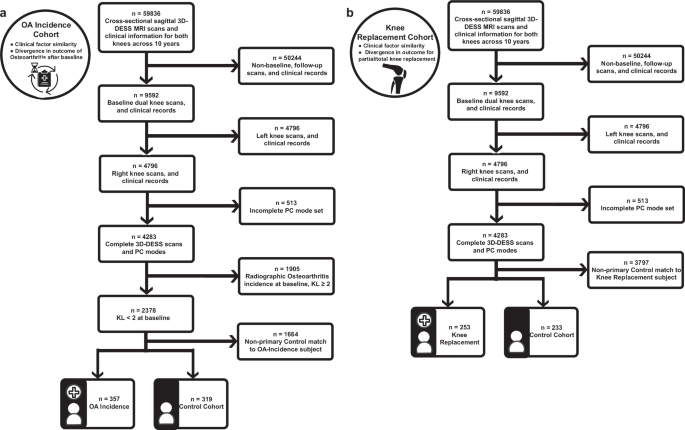
This figure presents flowcharts outlining the steps for cohort selection and data preprocessing, which were used to prepare high-quality datasets for subsequent analyses of OA Incidence and Knee Replacement outcomes in this study. a OA incidence cohort selection and data processing: Illustrates the selection process for the OA Incidence Cohort Analysis, detailing the progression from the initial dataset through various data cleaning stages, including the exclusion of subjects based on the completeness of 3D-DESS MRI scans, clinical records, and principal component modes. The final cohort consists of subjects with no initial osteoarthritis (Kellgren-Lawrence Grade [KL] <2) and their matched controls, all of whom are monitored for OA development over time. The medical chart icon in this panel was created by Kiranshastry and obtained from Flaticon. b Knee replacement cohort selection and data processing: Presents the selection process for the Knee Replacement Cohort Analysis, outlining the data cleaning steps, including the removal of subjects with incomplete data, and the application of stringent inclusion criteria. The final cohort includes subjects who underwent knee replacement surgery and their matched controls who did not.
Post-matching, the OA Incidence cohort consisted of 357 cases and 319 matched controls. The median age was 60 years in both groups, and the median BMI was approximately 29 kg/m². KOOS Pain subscale scores were similar between groups, with medians of 90.6 (IQR: 22.2) for the OA Incidence group and 91.7 (IQR: 19.4) for the Control group, indicating comparable levels of knee pain. The KOOS Quality of Life (QOL) scores were slightly lower in the OA Incidence group (median 68.8, IQR: 37.5) compared to the Control group (median 75.0, IQR: 31.2), suggesting a minor difference in knee-related quality of life (Supplementary Data 6).
In the KR cohort, the KR group included 253 participants to the Control group’s 233 participants. Both the KR and Control groups had a median age of 64 years and a median BMI of around 29 kg/m². KOOS Pain subscale scores were slightly lower in the KR group (median 72.2, IQR: 27.8) compared to the Control group (median 75.0, IQR: 25.4), suggesting marginally worse knee pain among those who underwent knee replacement. The KOOS QOL scores were similar between groups, with medians of 56.3 (IQR: 25.0) in the KR group and 56.3 (IQR: 31.3) in the Control group, reflecting greater knee dysfunction compared to the OA Incidence cohort (Supplementary Data 7).
These demographic and clinical characteristics establish a baseline profile for the matched cohorts. This alignment supports comparative analyses and strengthens the identification of imaging biomarkers associated with knee health outcomes.
Cohort-matching analytical integrity
To ensure that our matched cohorts were appropriately balanced and that any observed differences in imaging biomarkers were not due to confounding variables, we evaluated the analytical integrity of our cohort matching. The findings revealed that the matching technique reduced disparities across demographic and clinical variables, thereby improving the validity of subsequent analyses.
The comparability of the matched cohorts was evaluated using a series of statistical measures; we employed standardized mean difference (SMD) and Cohen’s d to quantify differences in continuous variables and Cramer’s V for categorical variables between the Outcome and Control groups. Additionally, we calculated the Point Biserial Correlation Coefficient to assess the strength of association between each covariate and group classification. To evaluate the statistical significance of any remaining disparities, we applied non-parametric hypothesis tests, including the Wilcoxon signed-rank test for paired continuous variables and the Chi-squared test for categorical data.
For the OA Incidence analysis, the matching process substantially improved the balance between the OA Incidence and Control groups. Figure 4a illustrates the significant reductions in SMD values for numerical covariates following matching, with values shifting from higher levels (teal) to lower levels (purple), reflecting improved covariate balance. Key variables such as age, BMI, and KOOS scores showed marked reductions in disparities after matching. Specifically, Cohen’s d values decreased significantly (see Supplementary Data 8); for example, Cohen’s d for BMI reduced from −0.528 before matching to −0.053 after matching, demonstrating a substantial improvement in balance. Additionally, reduced associations with group classification were observed, as the Point Biserial Correlation coefficients became non-significant for the majority of variables.

This figure evaluates the quality of cohort matching and accentuates significant differences in imaging biomarkers between the Control and Outcome groups for OA Incidence and Knee Replacement analyses. a OA incidence matching quality: Standardized Mean Difference (SMD) analysis compares numerical covariates before (teal) and after (purple) matching, visualizing improved balance (see Supplementary Data Table 8). b Knee replacement matching quality: The SMD assessment for numerical covariates illustrates the effectiveness of the matching process. Effect sizes are depicted in teal for pre-match and purple for post-match conditions, demonstrating improved equivalence between cohorts (see Supplementary Data Table 10). c OA incidence covariate balance: Bar plots depict the distribution of categorical covariates between Control (dark teal) and OA incidence (light teal) groups. This analysis highlights the improvement in balance for categorical variables, such as Sex (see Supplementary Data Table 9). d Knee replacement covariate balance: Bar plots illustrate the distributions of categorical covariates for Control (dark purple) versus Knee Replacement (light purple) groups. These plots show the success of the matching process in equalizing group characteristics (see Supplementary Data Table 11). e Significant features in OA incidence cohort study: Box plots display the distribution of significant PC mode features between the Control and OA incidence groups. Box plots display the median, interquartile range, and whiskers extending to 1.5 times the IQR. Statistical significance was determined using Paired Wilcoxon Rank Sum Tests with Benjamini-Hochberg correction for multiple comparisons (p-values adjusted using the Hochberg method). Significance levels are denoted as follows: single asterisk for p < 0.05, double asterisks for p < 0.01, and triple asterisks for p < 0.001, aligning with results in Supplementary Data Table 14. f Significant features in knee replacement cohort study: Box plots, as described in panel e, compare significant PC mode features between Control and Knee Replacement groups. Statistical significance was determined using Paired Wilcoxon Rank Sum Tests with Hochberg correction. Annotated p-values and significance thresholds are provided in Supplementary Data Table 15. The remaining significant PC mode plots not shown are in Supplementary Figs. 12 and 13.
Non-parametric tests further confirmed the success of the matching process. Results from the Wilcoxon signed-rank tests indicated that, for the majority of continuous variables, no significant differences remained between the Outcome and Control groups after matching. Minor significant differences remained for weight and BMI, with p-values of 0.025 and 0.036, respectively (see Supplementary Data 9). Despite these residual disparities, the effect sizes were greatly diminished compared to pre-matching, and the absolute differences were minimal. Figure 4c depicts the distribution of categorical covariates between the Control and OA Incidence groups post-matching, demonstrating improved balance for variables such as sex and race.
For the knee replacement analysis, the matching process effectively minimized disparities across most variables, as reflected by SMD and Cohen’s d values approaching zero. As shown in Fig. 4b, SMD assessments for numerical covariates illustrate the effectiveness of the matching process, with effect sizes decreasing from pre-match (teal) to post-match (purple), demonstrating improved equivalence between cohorts (see Supplementary Data 10). To provide an example, the Cohen’s d for KOOS Pain presented a substantial reduction in the disparity, with a decrease in magnitude from −0.649 to 0.015 post-matching. Similarly, the Point Biserial Correlation indicated weaker associations, with smaller coefficients and non-significant p-values.
Despite these improvements, the Chi-squared tests indicated that some categorical variables, such as race and Hispanic ethnicity, still exhibited significant differences post-matching. Specifically, the Chi-squared test for race yielded a statistic of 9.81 with a p-value of 0.020 (see Supplementary Data 11), suggesting that perfect balance was not achieved for this variable. While Cramer’s V values indicate lingering disparities for some categorical variables, Fig. 4d shows that the matching process effectively aligned the group characteristics, with only slight remaining differences.
In this way, this evaluation demonstrates the effectiveness of our cohort matching. By improving balance across demographic and clinical variables, the process reduces confounding effects and strengthens associations between imaging biomarkers and knee health outcomes. Residual differences are minimal and unlikely to impact results.
Cross-sectional analyses of imaging biomarkers for OA incidence and knee replacement
Building upon the matched cohorts, we conducted cross-sectional analyses to identify significant differences in imaging biomarkers between the Outcome and Control groups. Prior to these analyses, the normality, and variance of PC modes were evaluated using Shapiro–Wilk and Anderson-Darling tests to confirm statistical validity (see Supplementary Data 12 for OA Incidence and Supplementary Data 13 for Knee Replacement). We examined the 110 PC modes relative to each cohort and sought to elucidate the associations between the imaging biomarkers and the OA incidence and KR outcomes. By determining the joint features indicative of downstream knee outcomes, we initiate a solid basis for a comprehensive digital twin of the knee joint; these imaging biomarkers are the constituents of the model from which precise tracking and simulation of disease progression may be derived.
For the OA Incidence cohort, analyses using the Wilcoxon rank-sum test with Benjamini–Hochberg correction (α = 0.05) revealed significant differences in imaging biomarkers between the OA Incidence and Control groups. The cohort included 357 cases and 319 matched controls, and the analyses focused on structural and compositional features of the knee joint, including cartilage thickness, cartilage T2 relaxation times, and meniscus shape.
Cartilage Thickness Femur PC1 and PC2 showed significant decreases in the OA Incidence group compared to controls, with adjusted p-values of 4.12 × 10⁻4 and 6.11 × 10⁻6, respectively. This indicates thinner cartilage in critical regions of the femur among individuals who developed OA; this suggests that early cartilage degeneration in the femur may be a key indicator of OA onset. Similarly, significant decreases were observed in Cartilage Thickness Tibia PC9 (adjusted p-value = 0.00273), which reflects cartilage thinning in the tibial region.
Significant alterations were also found in cartilage composition. Cartilage T2 Femur PC7 (adjusted p-value = 3.96 × 10⁻5) and Cartilage T2 Tibia PC8 (adjusted p-value = 0.0416) exhibited significant decreases in the OA Incidence group. Changes in cartilage T2 relaxation times suggest variations in the biochemical properties of cartilage, such as collagen content and water distribution, which are essential for cartilage health.
Furthermore, significant differences were identified in meniscus shape PC modes. Medial Meniscus PC10 (adjusted p-value = 0.01195) and Lateral Meniscus PC1 (adjusted p-value = 0.04837) showed increases in the OA Incidence group compared to controls. Alterations in meniscal morphology may contribute to the mechanical environment that promotes OA progression. These findings reveal specific imaging biomarkers associated with the early stages of OA and stress the importance of both cartilage and meniscal changes in OA development.
Similar analyses revealed significant differences in PC modes related to bone shape, cartilage thickness, cartilage T2 relaxation times, and meniscus shape for the Knee Replacement cohort. The cohort included 253 subjects who ultimately underwent a partial or total knee replacement to remedy their failing joint and 233 matched control subjects who did not require surgical intervention.
Bone Shape Femur PC2 exhibited a significant increase in the KR group compared to controls (adjusted p-value = 2.55 × 10⁻5), which indicates alterations in femoral bone morphology associated with advanced joint degeneration. This demonstrates the importance of bone structural changes in the progression to joint dysfunction that necessitates surgical intervention. In contrast, Bone Shape Patella PC7 showed a significant decrease in the KR group (adjusted p-value = 0.00100), suggesting changes in patellar bone structure.
Significant decreases were observed in Cartilage Thickness Femur PC2 (adjusted p-value = 2.01 × 10⁻5) and Tibia PC2 (adjusted p-value = 2.01 × 10⁻5); this reflects substantial cartilage loss in key load-bearing regions of the knee joint. These structural changes contribute to joint dysfunction and pain experienced by individuals requiring knee replacement. Additionally, Cartilage Thickness Femur PC3 showed a significant increase (adjusted p-value = 1.33 × 10⁻4), which indicates regional variations in cartilage thickness alterations.
In terms of cartilage composition, Cartilage T2 Femur PC5 demonstrated a significant increase in the KR group (adjusted p-value = 1.18 × 10⁻5), while Cartilage T2 Femur PC7 exhibited a significant decrease (adjusted p-value = 1.38 × 10⁻4). Similarly, Cartilage T2 Tibia PC1 showed a significant increase (adjusted p-value = 1.04 × 10⁻4). These findings reveal the degradation of cartilage biochemical properties associated with more advanced disease stages.
Significant differences were also found in meniscus shape PC modes, particularly in the medial meniscus. Medial Meniscus PC3 (adjusted p-value = 1.04 × 10⁻4) and Medial Meniscus PC8 (adjusted p-value = 2.97 × 10⁻4) showed significant decreases in the KR group. This demonstrates the role of meniscal degeneration in the progression of knee joint instability to the point of requiring replacement surgery. Conversely, Medial Meniscus PC4 exhibited a significant increase (adjusted p-value = 5.06 × 10⁻4), which suggests complex alterations in meniscal morphology.
Integrated findings from cross-sectional analysis
The analyses of the OA Incidence and KR cohorts identified distinct structural and compositional changes in the knee joint associated with disease progression and surgical outcomes. In the OA Incidence cohort, early changes were observed, including significant decreases in cartilage thickness, alterations in cartilage composition, and morphological differences in meniscus shape. These biomarkers were consistently associated with the early stages of knee degeneration.
In parallel, analyses of the Knee Replacement cohort recognized meaningful biomarkers that reflected advanced joint degeneration. Substantial cartilage loss in key load-bearing regions, alterations in bone morphology, and meniscal degeneration were notable features distinguishing individuals requiring knee replacement surgery from matched controls. Bone shape and meniscus morphology were prominent contributors to group differences; this observable divergence is specific to structural changes associated with advanced disease stages.
Collectively, these biomarkers may provide key insights into modeling knee joint health and tracking disease progression dynamically. Supporting statistical results are detailed in Supplementary Data 14 and 15, with visual summaries in Fig. 4e, f, Supplementary Figs. 12 and 13.
Multivariate regression analysis for OA incidence and knee replacement cohorts
In order to extend the cross-sectional findings, we utilized multivariate regression to determine new imaging biomarkers of value and validate the importance of those previously identified. This approach functionally assessed the independent contributions of biomarkers to knee health outcomes while accounting for potential confounders. Consequently, these results allow us to better understand the structural and compositional factors of the joint; they support the creation of a digital twin framework for dynamic disease modeling and personalized monitoring.
We applied multivariate regression for the OA Incidence cohort using elastic net regularization within a generalized linear model (GLM). Elastic net regularization was chosen to manage multicollinearity among the numerous PC modes while performing feature selection, and stability selection ensured that the identified predictors were robust across different sample subsets (see Supplementary Data 16 for raw data). The analysis incorporated 110 PCs in addition to key demographic and clinical covariates such as age, BMI, and pain scores. Significant predictors were determined based on their weighted importance scores and inclusion frequency across bootstrap iterations (Fig. 5a, Supplementary Figs. 14a–d, 15, and Supplementary Data 17).

This figure presents imaging biomarkers identified through stability selection and multivariate analysis. These features have the potential to inform knee health dynamics and guide further exploration into biomarkers relevant to digital twin development. a OA incidence stability selection—overall top 20 features: This horizontal bar chart displays the top 20 significant variables associated with OA incidence, ranked by mean coefficients derived from bootstrap elastic net analysis over 1000 iterations. Positive effects extend to the right, while negative effects extend to the left, with 95% confidence intervals indicated by horizontal lines. Detailed results are available in Supplementary Data Table 17 and visualized by imaging biomarker category in Supplementary Fig. 14a–d. b Knee replacement stability selection—overall top 20 features: Presents a horizontal bar chart of the top 20 significant variables for knee replacement outcomes, also ranked by mean coefficients from bootstrap elastic net analysis with 1000 iterations. Positive effects extend to the right, negative effects to the left, with 95% confidence intervals indicated. Additional details are in Supplementary Data Table 20 and categorized views are shown in Supplementary Fig. 14e–h. c Distribution plots of PC modes for OA incidence: Features violin plots of significant PC modes from the final GLM logistic regression, comparing OA incidence (light teal) and Control groups (dark teal). The violin plots are superimposed with dot plots representing Kellgren-Lawrence (KL) grades, a radiographic measure of OA severity (KL grade ≥2 indicates radiographic OA). Dot plots reflect ultimate knee outcomes over time in the OAI study. Statistical details are provided in Supplementary Data Table 18 and further visualized in Supplementary Fig. 15. d Distribution plots of PC modes for surgical intervention: Violin plots display significant PC modes from the final GLM logistic regression, comparing Control (dark purple) and Knee Replacement (light purple) groups, further stratified by non-replacement, partial replacement, and total knee replacement. These dot plots reflect ultimate knee outcomes over time in the OAI study. Additional statistical details can be found in Supplementary Data Table 21 and further visualized in Supplementary Fig. 16.
Several PC modes related to cartilage thickness and cartilage T2 relaxation times emerged as significant predictors of OA incidence (Fig. 5c and Supplementary Data 18). Specifically, higher scores in Cartilage T2 Femur PC7 (odds ratio [OR] = 0.949; 95% confidence interval [CI]: 0.918–0.982; p = 2.35 × 10⁻³) and Cartilage Thickness Femur PC1 (OR = 0.973; 95% CI: 0.959–0.987; p = 1.82 × 10⁻⁴) were associated with decreased odds of OA incidence. This suggests that preserved structural and compositional characteristics in femoral cartilage may protect against early joint health decline. Similarly, Cartilage Thickness Femur PC2 demonstrated a protective role (OR = 0.960; 95% CI: 0.935–0.985; p = 2.05 × 10⁻³), further reinforcing its relevance as a marker of resilience in joint health and a candidate for dynamic tracking within a digital twin framework.
Conversely, higher scores in Cartilage T2 Patella PC3 (OR = 1.049; 95% CI: 1.001–1.099; p = 4.37 × 10⁻²) and Cartilage Thickness Patella PC7 (OR = 1.061; 95% CI: 1.004–1.121; p = 3.61 × 10⁻²) were associated with increased odds of OA incidence, indicating that specific patellar cartilage changes may signify an elevated risk of degeneration. Meanwhile, higher scores in Cartilage T2 Patella PC4 (OR = 0.950; 95% CI: 0.902–0.999; p = 4.68 × 10⁻²) were associated with decreased odds of OA incidence that preserved biochemical properties of the patellar cartilage could mitigate risk.
In the tibial cartilage, Cartilage T2 Tibia PC7 (OR = 0.935; 95% CI: 0.888–0.985; p = 1.10 × 10⁻²) and Cartilage T2 Tibia PC8 (OR = 0.944; 95% CI: 0.898–0.992; p = 2.31 × 10⁻²) showed protective effects against OA incidence; this emphasizes the importance of maintaining tibial cartilage composition in preventing early disease onset. These findings further support the utility of these biomarkers for dynamic simulation and monitoring within the digital twin framework. Additionally, Cartilage Thickness Tibia PC7 demonstrated a protective role (OR = 0.943; 95% CI: 0.903–0.984; p = 7.44 × 10⁻³), while Cartilage Thickness Tibia PC5 was associated with increased OA risk (OR = 1.039; 95% CI: 1.002–1.079; p = 4.10 × 10⁻²). These findings emphasize structural variations that may predispose individuals to degeneration.
Additionally, Medial Meniscus PC10 was modestly associated with increased OA incidence odds (OR = 1.026; 95% CI: 1.002–1.051; p = 3.28 × 10⁻²). This indicates that morphological changes in the meniscus may influence the mechanical environment of the knee joint and contribute to the early stages of OA development.
In the Knee Replacement cohort, multivariate regression revealed significant predictors of advanced joint degeneration requiring surgical intervention. The analysis utilized the same 110 PCs to discern factors contributing to advanced joint instability (Fig. 5b, Supplementary Figs. 14e–h, 16, and Supplementary Data 19 and 20). Significant predictors included PC modes related to bone shape, cartilage thickness, and cartilage T2 relaxation times (Fig. 5d, Supplementary Data 21).
Bone Shape Tibia PC9 was associated with an increased likelihood of knee replacement (OR = 1.038; 95% CI: 1.016–1.059; p = 4.82 × 10⁻⁴). This highlights tibial bone morphological changes that contribute to advanced joint instability and may serve as an indicator for surgical intervention. Conversely, Cartilage T2 Tibia PC7 displayed a protective effect (OR = 0.890; 95% CI: 0.833–0.952; p = 6.18 × 10⁻⁴), suggesting that preserved cartilage composition in specific tibial regions mitigates the progression toward severe joint degeneration.
In tibial cartilage thickness, Cartilage Thickness Tibia PC1 (OR = 1.034; 95% CI: 1.014–1.054; p = 7.52 × 10⁻⁴) and PC5 (OR = 1.060; 95% CI: 1.012–1.111; p = 1.41 × 10⁻²) were associated with increased risk, which potentially reflects structural changes in load-bearing areas that exacerbate joint degradation. In contrast, PC2 (OR = 0.939; 95% CI: 0.911–0.968; p = 4.58 × 10⁻⁵) and PC8 (OR = 0.932; 95% CI: 0.884–0.983; p = 9.40 × 10⁻³) showed protective effects, indicating that specific features of tibial cartilage integrity might reduce susceptibility to severe outcomes.
In the femoral cartilage, Cartilage T2 Femur PC5 (OR = 1.064; 95% CI: 1.027–1.102; p = 6.11 × 10⁻⁴) and PC10 (OR = 1.073; 95% CI: 1.026–1.122; p = 2.04 × 10⁻³) were significant risk factors; this suggests that compositional changes may mark advanced stages of degeneration. Contrastingly, Cartilage Thickness Femur PC2 (OR = 0.948; 95% CI: 0.927–0.970; p = 3.88 × 10⁻⁶) demonstrated a protective role, reinforcing its importance as a key metric for structural integrity and dynamic tracking within the digital twin framework.
Furthermore, cartilage thickness patella PC3 (OR = 1.062; 95% CI: 1.015–1.110; p = 8.69 × 10⁻³) and Cartilage T2 Patella PC9 (OR = 1.145; 95% CI: 1.041–1.259; p = 5.31 × 10⁻³) were associated with increased risk of knee replacement. This emphasizes the contribution of patellar cartilage alterations to joint dysfunction in advanced stages of degeneration.
Integrated findings from multivariate regression
The multivariate regression analyses identified imaging biomarkers that independently correlate with OA incidence and knee replacement outcomes; said biomarkers reveal distinct structural and compositional characteristics of the knee joint. In the OA Incidence cohort, early changes were characterized by protective features such as preserved femoral and tibial cartilage thickness and composition. In contrast, the Knee Replacement cohort showed advanced degeneration markers; alterations appeared in bone morphology and cartilage in key load-bearing regions.
Together, these results provide a comprehensive basis for understanding the progression of joint degeneration across disease stages. By characterizing both early resilience and advanced deterioration, these findings establish a framework for dynamic monitoring and modeling of joint integrity; as such, the recognized features have potential application in digital twin systems to track and forecast knee health dynamics. Supporting statistical results are detailed in Supplementary Data 18 and 21, with visual summaries in Fig. 5a–d.
Core biomarker indicators for digital twin development
Integrating the findings from the cross-sectional cohort analyses and multivariate regression models, we identified imaging biomarkers consistently linked to knee health outcomes across multiple analytical approaches. These biomarkers demonstrated potential reliability as markers of osteoarthritis incidence and predictors of the need for knee replacement surgery. Their consistent associations suggest their potential for integration into a digital twin framework for modeling knee joint health.
In the OA Incidence cohort, biomarkers such as Cartilage Thickness Femur PC1 and PC2, Cartilage T2 Femur PC7, and Tibia PC8 emerged as protective factors, while Medial Meniscus PC10 was associated with increased OA risk. Similarly, in the KR cohort, Cartilage Thickness Femur PC2 demonstrated a protective role, with other biomarkers, including Cartilage T2 Femur PC5 and Bone Shape Tibia PC9, linked to increased surgical risk. The identification of Cartilage Thickness Femur PC2 as a protective factor across both cohorts and analyses suggests it could serve as a potential key metric for tracking femoral cartilage integrity within a digital twin framework.
Figure 6 presents the main biomarkers discovered through our analyses and their association with OA progression and knee replacement outcomes; these biomarkers show potential utility in the early detection of OA, monitoring advanced joint degeneration, and understanding protective effects. In this way, these markers may aptly serve as a basis for risk assessment and the development of a digital twin model for personalized knee health monitoring.

This figure integrates findings from cohort matching and multivariate regression analyses, identifying imaging biomarkers consistently associated with OA incidence and knee replacement outcomes, which serve as foundational components for building a knee joint digital twin system. a OA Incidence Biomarkers: Emphasizes biomarkers significantly associated with the incidence of osteoarthritis, identified through Clinical Cohort Matching and Multivariate Regression Analyses. Emphasizes specific anatomical and molecular changes linked to the early detection and progression of OA. b Knee Replacement Biomarkers: Presents biomarkers that distinguish between Control subjects and those who underwent knee replacement surgery. These biomarkers were identified as the most impactful for predicting surgical outcomes through cohort matching and regression. c Dual Protective Biomarker: Features a biomarker that consistently demonstrates protective effects against both the onset of OA and the need for knee replacement. Based on cohort comparisons and multivariate models, the findings suggest potential therapeutic intervention targets. d Biomarker Selection Overview: Synthesizes the tissue-biomarker combinations identified as significant across analyses for both OA incidence and knee replacement. The repeated recognition of these biomarkers across analyses accentuates their influence on knee health outcomes and posits their utility for further investigation.
link