

Study design
This is a longitudinal, retrospective, multicentre study conducted in two NH, which will be referred to hereafter as NH-1 and NH-2, supervised by the hospital-based Geriatric team of our Hospital during the first wave of COVID-19.
The primary objective of the study was to determine the levels of secretory IgA against the S1 domain of the SARS-CoV-2 spike protein (SIgA-S1) in this population. Secondary objectives were to evaluate differences between patients with “induced” or “non-induced” SIgA-S1 in general population characteristics, baseline status according to the Comprehensive Geriatric Assessment (CGA), clinical severity of COVID-19, symptom duration, 30-day mortality, and reinfection rate.
Population studied
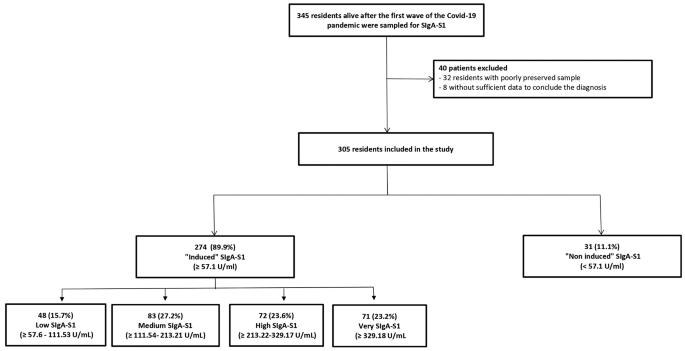
The inclusion criteria of the study were being a NH resident and being alive after the first wave of the Covid-19. Those whose frozen specimen was not well preserved – or was insufficient for analysis – were excluded. As well, subjects with incomplete medical records regarding COVID-19 symptoms and/or vital signs throughout the study period, were also excluded.
Procedures
On May 11th in NH-1 and on May 17th, 2020 in NH-2, after the acute phase of the first wave of COVID-19, the hospital-based Geriatric team performed a mass screening by performing a PCR test for SARS-CoV-2 on all admitted residents, with the aim of early isolation of positive cases. Samples were frozen and stored at -80 °C in the laboratory freezers until analyzed for SIgA-S1 on May 2023. The freezers were continuously monitored to ensure that temperature variations did not exceed 1.5% throughout the storage period. In addition, sample stability was ensured through size assessment of protein integrity via electrophoresis with selected samples in the same rack. We developed and conducted a custom indirect ELISA to evaluate the levels of secretory IgA against SARS-CoV-2 spike S1 domain (SIgA-S1) in nasopharyngeal swabs obtained. Nunc 96-well ELISA plates (Thermo Fisher Scientific, Waltham, MA, USA, 439454) were coated with 0.5 µg of SARS-CoV-2 Spike Protein (Recombinant Human Novel Coronavirus Spike glycoprotein (S), Partial (Active)) supplied by Cusabio Technology LLC (Houston, TX, USA, CSB-YP3324GMY1) in 100 µL of 0.05 M carbonate-bicarbonate buffer, pH 9.6 (Sigma-Aldrich, St. Louis, MO, USA, C3041-50 CAP) per well. The plates were incubated overnight at 4 °C. Subsequently, four washes were performed using 100 µL of washing buffer containing 1x phosphate-buffered saline (PBS) (Fisher Scientific, Loughborough, UK, BP2944-100) and 0.05% Tween20 (PanReac Química S.L.U., Barcelona, Spain, 142312.1611). Following this, the wells were blocked with 200 µL of 1% bovine serum albumin (BSA) in Tris-buffered saline (50 mM Tris, 0.14 M NaCl, pH 8.0) (Sigma-Aldrich, T6789-10PAK) and incubated for 30 min at room temperature (RT). Four plate washes were performed using 300 µL of washing buffer per well. Duplicate samples (100 µL each), thawed and vortexed prior to use, were added to the corresponding wells and incubated for 1 h at RT. Human sera with known IgA activity (obtained from a commercial kit, AESKULISA® SARS-CoV-2 S1 IgA, AESKU.DIAGNOSTIC, Wendelsheim, Germany, 6124) were also added to the plates to generate a calibration curve. After the incubation with samples or standards, the plates were washed five times. Subsequently, 100 µL/well of a 0.01 µg/mL secondary antibody, Goat anti-human IgA HRP-conjugated (Fortis Life Sciences, 34021), was added to each well and incubated for 1 h at RT. The washing procedure was repeated, and to reveal the plates, 100 µL/well of TMB substrate solution (Thermo Fisher Scientific, 34021) was added and incubated for 5 min in the dark. The reaction was stopped by adding 100 µL/well of 1 M HCl (PanReac Química S.L.U, 131020.1612). The optical density (OD) at 450 nm with a reference wavelength of 620 nm was measured using an ELISA reader (SmartSpec ™ 3000, Bio Rad). The blank OD was subtracted from the sample readings, and the concentration was calculated using the equation of the standard curve fitted to a linear regression model.
We used the positive and negative controls supplied in the kit as positive and negative controls and applied the cut-off formula, defined as the mean plus three times the standard deviation [17]. Therefore, the negative control was set at 2.76 U/mL, while the positive cut-off point at 57.6 U/mL. Thereby, we classified samples equal to or above 57.6 U/mL as “induced”, while those below this threshold as “non-induced”. Furthermore, we additionally calculated cut-off values to divide the samples into different SIgA-S1 levels due to the wide range of values. We obtained these cut-off values by Change-Point detection analysis, using the R package “changepoint“ [18]. This method has been validated for identifying cut-off points in ELISAs in the absence of controls [19]. Following the protocol described by Lardeux et al. 2016, we sorted the SIgA-S1 values in ascending order and in the R package we employed the Binary Segmentation algorithm with the CUSUM method as a detection option [20]. In this regard, we further classified the “induced” SIgA-S1 values into four degrees of induced positivity according to the three change points detected and the threshold of the positive control as shown in Fig. 1.
Data collection
To obtain data regarding patient’s baseline characteristics, clinical manifestations and severity of symptoms, a comprehensive and systematic review of each individual’s electronic medical records was carried out by the research team, comprised by physicians and nurses specialized in geriatrics (in collaboration with the NH care staff). Demographic characteristics, CGA information, and comorbidities present 2 weeks before the first case of Covid-19 (March 15th) were registered. From March 15th onwards, the presence of COVID-19 symptomatology –according to WHO criteria – was registered until 14 days after the PCR was performed in both NH, as this period of time was considered to respect the incubation period of the disease [21, 22] (Figure S1). The variables included in the study are described in detail in the Supplement 1. Finally, positive/negative PCR results for SARS-CoV-2 and their cycle threshold (Ct) were recorded.
Based on positive SARS-CoV-2 PCR test, COVID-19 reinfection diagnosis was assessed within three months of IgA sampling at both NH. Additionally, 30-day mortality analyzed, as well as the setting in which it occurred (hospital vs. NH).
Statistical analysis
In light of previous studies, which reported the proportion of SARS-CoV-2 positive patients during the first wave of the COVID-19 pandemic to be between 70% and 80% [23], we determined that a sample size of 345 residents would be necessary. This calculation aimed to ensure a precision error of less than 5% and a confidence interval of 95%, while also considering an expected loss rate of 15%.
For descriptive analysis, absolute (n) and relative (%) frequencies were used to express categorical variables. Confidence intervals at 95% were calculated for these proportions. To analyse quantitative variables, mean and standard deviation or median and interquartile range were used and interquartile range according to the results obtained from the Shapiro Wilk or Kolmogorov-Smirnov normality test. In order to analyse the existence or not of statistically significant differences with respect to the variables of interest between “induced” and “non-induced” residents as well as between severe and non-severe cases, and those with symptoms lasting form more or less than 10 days, Chi-square tests or Fisher’s Exact Tests were used for qualitative variables, and the Student’s T-test or the Mann Whitney U-test for quantitative variables according to the normality of the variables analysed.
Finally, to discriminate the ability of SIgA-S1 values to predict the severity and duration of symptoms > 10 days, ROC curves were analyzed, calculating the AUC and its 95% confidence interval (CI). In this regard, SIgA-S1 values were considered as continuous variables. For each ROC curve, a score above 0.7 was considered acceptable predictive ability and below 0.6 as unacceptable [24]. In addition, the SIgA-S1 cutoff point of maximum likelihood between sensitivity and specificity was calculated to predict severity and duration of symptoms > 10 days. All statistical calculations were performed using SPSS statistical software (version 23.0 IBM Corp; USA).
Ethical issues
The study complied with good clinical practice standards set forth in the Declaration of Helsinki of 1975 and was approved by the relevant institutional review boards: the Ethics and Drug Research Committee of our reference, the Research Committee of the Hospital and by the Ethics Committee of the University.
link