


Over the study period (2010–2023), the proportion of critically ill nonagenarian admissions steadily increased across 211 ICUs in New Zealand and Australia, rising from 1.22% of total admissions in 2010 to a high of 1.93% in 2019, before slightly declining to 1.62% in 2023. ICU mortality decreased from 9.98% in 2010 to 6.63% in 2023, with hospital mortality also demonstrating a downward trend from 21.69% in 2010 to 15.23% in 2023 (Fig. 2).
After excluding patients with missing data and those receiving palliative care, the final analysis included 16,439 nonagenarians admitted to the ICU between 2020 and 2023. Of these patients, 6459 were classified as non-frail, and 9980 as frail. The overall ICU and hospital mortality rates were 6.19% and 14.49%, respectively. PSM resulted in a matched cohort of 8220 patients (Tables 1 and 2).

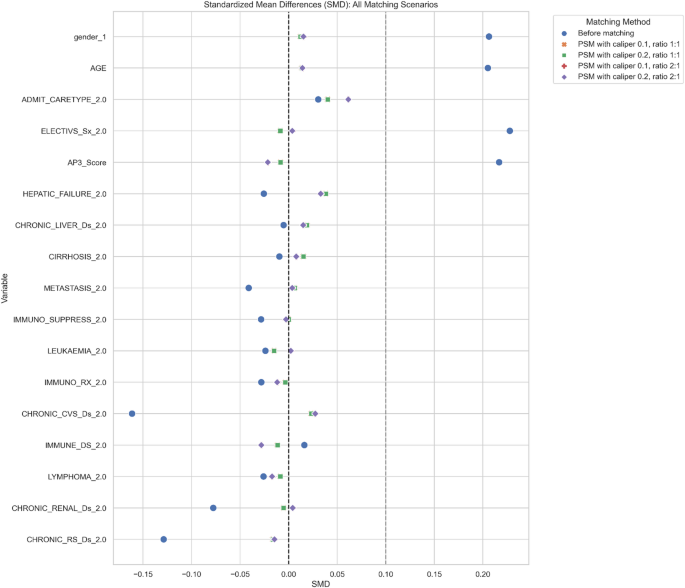
Love Plot: Standardized mean differences before and after propensity score matching (PSM) with calipers 0.1–0.2 and ratios 1:1–2:1

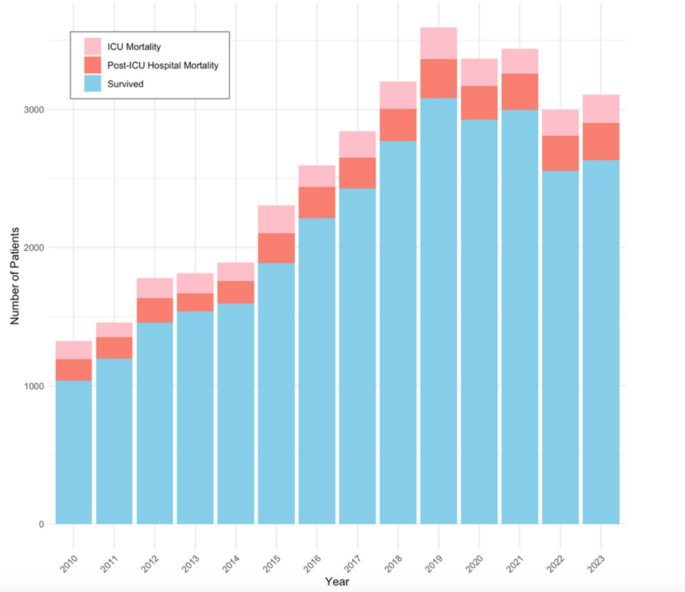
Survival and mortality rates for all nonagenarians admitted to ICU (2010–2023). Trends in ICU mortality, post-ICU hospital mortality, and survival for ICU patients aged ≥90 years show an overall improvement in survival rates over time. ICU mortality decreased from 9.98% in 2010 to 6.63% in 2023, while hospital mortality declined from 21.69% to 15.23%
Baseline characteristics of original and propensity-matched cohorts
Tables 1 and 2 present the baseline characteristics of the original and propensity-matched cohorts. In the original cohort, frail patients were significantly older, more often female, and had a higher prevalence of chronic respiratory, cardiovascular, and renal comorbidities than non-frail patients (all p < 0.001). Elective surgical admissions were less frequent in the frail subgroup, consistent with their higher acuity burden. Median APACHE III-J scores were also significantly higher in frail patients (64 [54–76]) compared to their non-frail counterparts (60 [51–72]; p < 0.001), reflecting a greater overall burden of illness at ICU admission, including age, comorbidities, and physiological disturbance.
PSM resulted in a well-balanced distribution of baseline variables between frail and non-frail patients. All SMDs were below the commonly accepted threshold of 0.1, indicating successful covariate adjustment. In the matched cohort, median APACHE III-J scores were comparable between frail and non-frail patients (62 [53–73] in both), confirming appropriate matching on illness severity and baseline risk.
Impact of frailty on ICU and hospital mortality
Tables 1 and 2 present ICU and hospital mortality outcomes in both the original and propensity-matched cohorts, stratified by frailty status. In the original cohort, ICU mortality was significantly higher in frail patients than non-frail patients (6.5% vs. 4.2%, p < 0.001). This disparity was more pronounced for hospital mortality, with the incidence in frail individuals nearly twice that in their non-frail counterparts (15.9% vs. 9.3%, p < 0.001). These findings highlight the profound vulnerability of frail patients admitted to the ICU, with an elevated mortality risk that extends beyond the acute phase of care.
Following PSM, which was designed to minimize confounding by balancing key covariates such as age, comorbidities, admission type, and illness severity, mortality differences were still observed. While ICU mortality remained elevated in frail patients (5.2% vs. 4.7%), this difference was no longer statistically significant (p = 0.416), suggesting partial attenuation of risk following adjustment. However, hospital mortality remained significantly higher in the frail group (13.8% vs. 10.6%, p < 0.001), indicating the persistent and substantial influence of frailty on outcomes beyond the ICU, despite matched baseline risk profiles.
These results underscore the prognostic significance of frailty for both short-term ICU outcomes and overall hospital survival. The persistence of mortality disparities post-matching emphasizes the independent contribution of frailty to adverse outcomes, beyond traditional predictors such as age and illness severity scores.
Table 3 presents the results of univariable and multivariable Cox proportional hazards models evaluating predictors of ICU and hospital mortality in the propensity matched cohort. In the multivariable model for ICU mortality, frailty (defined as CFS ≥ 5) was independently associated with increased hazard of death (adjusted HR 1.242, 95% CI 1.044 to 1.440, p = 0.017), even after controlling for admission type and illness severity. APACHE III-J score remained a strong predictor of ICU mortality (adjusted HR 1.045 per unit increase, 95% CI 1.041 to 1.049, p < 0.001). Interestingly, non-elective surgical admissions carried a substantially higher mortality risk compared to medical admissions (unadjusted HR 7.184, 95% CI 5.425 to 11.412, p < 0.001); however, this variable was not retained in the final adjusted model due to multicollinearity.
Frailty again emerged as a significant independent risk factor for hospital mortality (adjusted HR 1.352, 95% CI 1.192 to 1.534, p < 0.001). Female sex was associated with a lower risk of hospital mortality than male sex (adjusted HR 0.826, 95% CI 0.728 to 0.937, p = 0.003). Neither age nor admission category remained a significant predictor in the final multivariable hospital mortality model.
These findings establish frailty as an independent and robust predictor of both ICU and hospital mortality among critically ill nonagenarians, even after adjusting for illness severity and other confounders. Frailty’s stronger association with hospital mortality highlights its enduring impact beyond the acute ICU phase.
Frailty, when modelled as a continuous variable, was a strong and independent predictor of both ICU and hospital mortality, as demonstrated by multivariable logistic regression models adjusting for age, sex, admission type, comorbidities, and APACHE III-J score in the propensity matched cohort (see Tables 4 and 5). Specifically, each one-point increase in frailty score was associated with a 9% increase in the odds of ICU mortality (adjusted OR 1.09, 95% CI 1.01 to 1.18, p = 0.026) and a 19% increase in the odds of hospital mortality (adjusted OR 1.19, 95% CI 1.10 to 1.28, p < 0.001). These associations remained statistically significant after adjusting for key clinical covariates and were further supported by likelihood ratio testing, which confirmed the appropriateness of treating frailty as a continuous variable. Taken together, these findings underscore frailty’s prognostic value as a quantitatively meaningful and clinically actionable indicator of mortality risk in critically ill nonagenarians.
The Fine–Gray competing risks analysis (Table 6) demonstrated an independent association between frailty and a higher risk of both ICU (sHR 1.295; 95% CI 1.047–1.601; p < 0.001) and hospital mortality (sHR 1.355; 95% CI 1.184–1.550; p < 0.001), after adjusting for illness severity in the propensity matched cohort. This confirms frailty’s role as a strong, time-sensitive predictor of in-hospital death, reinforcing its clinical relevance beyond chronological age alone.
APACHE III-J score remained a significant independent predictor in both models, highlighting the complementary prognostic value of acute physiological derangement and baseline functional vulnerability. Additionally, female sex was protective against hospital mortality (sHR 0.796; 95% CI 0.694–0.912; p < 0.001), consistent with known sex survival differences in critical illness [18]. These findings support the use of routine frailty assessment alongside severity scoring to inform early goals-of-care discussions and resource allocation in very elderly ICU patients.
Impact of frailty on ICU and hospital lengths of stay
Table 1 illustrates that, in the original cohort, frail patients experienced significantly longer ICU and hospital stays compared to their non-frail counterparts. While frail patients experienced a moderately longer median ICU LOS (1.66 vs. 1.45 days, p < 0.001), the difference in their hospital LOS was more pronounced, reflecting an 18% relative increase (10.6 vs. 8.97 days, p < 0.001). Following PSM, the difference in ICU LOS was no longer statistically significant (1.6 vs. 1.5 days, p = 0.571), suggesting that the initial disparity was attributable to confounding factors such as comorbidity burden and illness severity. In contrast, the difference in hospital LOS persisted post-matching (10.7 vs. 9.1 days, p < 0.001), indicating an independent association between frailty and prolonged hospitalization.
This observation was further supported by multivariable linear regression modelling in the propensity matched cohort (Table 7), which demonstrated no significant association between frailty and ICU LOS in the adjusted model (β = 0.997, 95% CI 0.982 to 1.013; p = 0.739), confirming the absence of a meaningful effect on ICU duration. However, frailty remained independently associated with extended hospitalization, with a 5.1% relative increase in total hospital LOS (β = 1.051, 95% CI 1.033 to 1.070; p < 0.001) after adjusting for age, sex, admission type, comorbidities, and APACHE III-J score. This likely reflects increased care complexity and delayed recovery trajectories among frail patients, rather than differences in ICU-level interventions.
As demonstrated in Table 6, the Fine–Gray competing risks regression confirmed that extended LOS in frail patients was primarily a consequence of excess in-hospital mortality, rather than delayed recovery. Frailty was associated with a significantly higher sub-distribution hazard of hospital mortality, suggesting that frail patients’ prolonged hospitalization predominantly reflected increased time spent in hospital prior to death, rather than delayed discharge among survivors. This finding reinforces the interpretation of frailty as a marker of physiological vulnerability and progressive clinical deterioration.
Additional covariates were also independently associated with LOS outcomes. Higher APACHE III-J scores predicted longer ICU stays (β = 1.004, 95% CI 1.004 to 1.005; p < 0.001), consistent with established evidence linking illness severity with ICU resource utilization [19]. Female sex was associated with shorter hospital LOS (β = 0.973, 95% CI 0.948 to 1.000; p = 0.048), aligning with prior studies [18] that found sex-based differences in physiological resilience and recovery among older adults.
Combined, these findings demonstrate that, after adjusting for clinical severity, frailty does not prolong ICU stay but is independently associated with extended hospitalization and increased in-hospital mortality. This underscores the value of integrating frailty assessment into ICU triage, care planning, and discharge strategies, particularly in very elderly populations with complex post-acute needs.
link