

Between January 2019 to December 2021, a total of 9169 patients were admitted to the hospital. One hundred and twenty-four (1.35%) of them received enteral feeding tubes which were inserted during or before hospitalization. Figure 1 presents an overview of the participant flow throughout the study. During which, 66.9% of the patients admitted to our medical center arrived with a pre-existing feeding tube and 33.1% had one inserted during their hospitalization. The follow-up duration ranged from a minimum of 0.1 months to a maximum of 62.9 months, with a median duration of 12.7 months and a total cumulative duration of 1911 patient-months. Most patients had a NGT (95/124) and 29 had PEGs. Their ages ranged from 56 to 104 with a median age of 85 years, and 71 (57.3%) were females.
Of the 124 patients receiving enteral feeding, during the study period 90 (76%) patients died, and 49 of them died during hospitalization. Most patients (82/124) started enteral feeding before their hospitalization. Of these 82 patients, 10 died during the first year and 53 died during the study period.
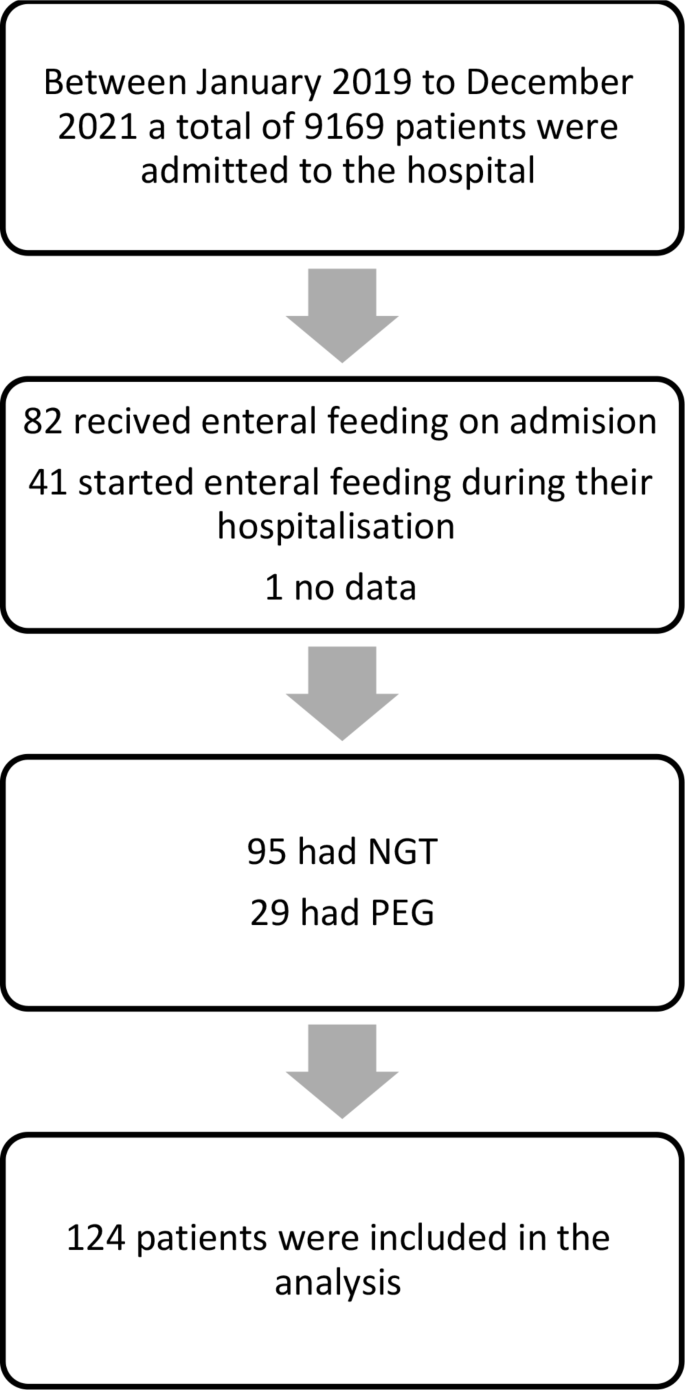
Participant flow chart. Abbreviations NGT, Nasogastric tube; PEG, Percutaneous endoscopic tube
Table 1 presents demographic and clinical characteristics and their association with mortality rate in a univariate analysis. A significant correlation was found between marital status and mortality rates. Specifically, divorced and widowed individuals exhibited a higher mortality rate (HR = 2.60, 95% CI [1.19–5.70], p = 0.017 and HR = 1.56, 95% CI [0.98–2.49], p = 0.062 respectively) compared to their married counterparts. Conversely, factors such as sex and number of children did not yield statistically significant differences in the mortality rate. Furthermore, examining the causes of hospitalization, patients admitted due to neoplasm disease (p = 0.018) and sepsis (p = 0.011) exhibited significantly higher mortality rates compared to those with other causes, however, the number of patients with these causes for hospitalization was very low. Factors such as CVA, fever, pneumonia, UTI, cellulitis, and pressure ulcers did not yield statistically significant differences in the mortality rate. In terms of Norton scores, none of the categories showed statistically significant differences in mortality rates, however, most patients (122 of 124) had low Norton scale scores (lower than 14). Most patients (97/124) had a SNAQ score of 2 or less. Neither the SNAQ score nor weight loss showed a statistically significant effect on the mortality rate (p-value 0.83 for SNAQ score and 0.6 for weight loss), nor did the type of inserted tube (PEG or NGT) or type of nutrition formula. Additionally, the number of chronic illnesses and the number of medications (polypharmacy) did not have a significant effect. Among the chronic illnesses assessed, pressure ulcers (HR = 1.76, 95% CI [1.08–2.88], p = 0.024), oxygen use (HR = 1.60, 95% CI [1.05–2.45], p = 0.030), and fever (HR = 1.50, 95% CI [0.99–2.26], p = 0.056) showed significant associations with mortality rates. Conversely, hypothyroidism, chronic obstructive pulmonary disease (COPD), diabetes mellitus (DM), delirium, and consciousness did not exhibit statistically significant differences in the mortality rates. In terms of TSH levels, none of the categories showed statistically significant differences in the mortality rate. No differences were found between patients receiving EN prior to their hospitalization and those with new EN (Table 1; Fig. 2).

Kaplan-Meier cumulative survival curves for patients receiving tube feeding before or during hospitalization
Table 2, presents the selected blood test results of the patients and their association with mortality rate in a univariate analysis. The results demonstrate a significant association of the mortality rate with RDW (HR = 1.06, 95% CI [1.01–1.12], p = 0.022). In contrast, no statistically significant associations with mortality rate were found for other hematological and biochemical laboratory data including nutritional parameters such as hemoglobin, lymphocytes, albumin, creatinine, vitamins, and iron. During the follow-up period starting from the time of feeding tube insertion (that was before, during, or after the hospitalization) several parameters had a significant correlation to mortality (Fig. 3). Widowed individuals exhibited a striking higher mortality rate (HR = 3.11, 95% CI [1.83–5.26], p < 0.001), while divorced individuals faced an even more substantial higher risk compared to the reference category (HR = 4.63, 95% CI [1.98–10.81], p < 0.001). Individuals admitted to the hospital due to sepsis had a striking higher mortality rate (HR = 9.90, 95% CI [2.12–46.17], p = 0.004), and those with neoplasm faced a relatively high mortality rate (HR = 5.34, 95% CI [2.15–13.25], p < 0.001), however, the number of patients was very small. Furthermore, patients with fever and the use of oxygen exhibited a higher risk of mortality (HR = 1.65, 95% CI [1.03–2.65], p = 0.036, and HR = 1.82, 95% CI [1.11–2.98], p = 0.018) respectively.
Additionally, higher RDW levels correlated with a high mortality rate (HR = 1.08, 95% CI [1.02–1.15], p = 0.011). On the contrary, individuals with hypothyroidism showed a lower risk of mortality (HR = 0.45, 95% CI [0.25–0.80], p = 0.007).

Cox proportional survival curves for mortality risk factors during follow-up: multivariable analysis results. * * Models adjusted for sex, age at feeding, marital status, pressure ulcer, hypothyroidism, oxygen use, fever, and cause of hospitalization: sepsis and neoplasm
Table 3 presents the one-year follow-up multivariant survival analysis specifically focusing on outcomes following feeding tube insertion. In this analysis, similar trends were observed. Men, widowed, and divorced individuals exhibited significantly elevated risks of mortality (HR = 3.18, 95% CI [1.64–6.16], p = 0.001), HR = 3.37, 95% CI [1.67–6.81], p = 0.001), and (HR = 5.26, 95% CI [1.80–15.38], p = 0.002) respectively. Neoplasm was once again associated with a notably higher risk of mortality (HR = 5.60, 95% CI [2.00–15.69], p = 0.001), however, the number of patients was low. Notably, RDW levels exhibited an increased risk of mortality (HR = 1.08, 95% CI [1.00–1.17], p = 0.048), while hypothyroidism and low Lymphocyte percentage showed a decreased risk (HR = 0.37, 95% CI [0.15–0.95], p = 0.040) and (HR = 0.93, 95% CI [0.88–0.98], p = 0.005) respectively. Pressure ulcers and MCHC did not demonstrate statistically significant associations with mortality risk in the multivariant analysis.
link